Summary: Latitude vs. Cloudiness
Are you kidding me? This probably shouldn't have even been made
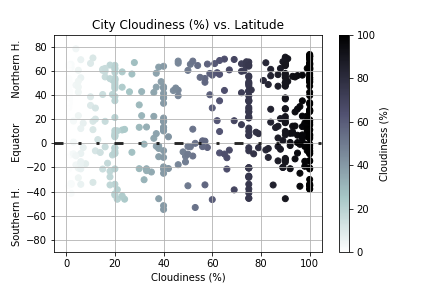
Here's why: have a look at the chart. Yes, there are plots across at various percentages of cloud cover. But there are 5 distinct lines of points on this chart:
- At 20%
- At 40%
- At 75%
- At 90%
- At 100%
Cloud cover is perhaps the most subjective meteorological condition there is. For instance, different countries have different standards for what percent cloudiness constitues a "partly cloudy" sky. In addition, there is significant rounding that occurs in many of the observations.
It does make for a cool chart though.
Visualizations